Grafana
Nortech uses Grafana as the main cloud data visualization tool. Grafana is a powerful open-source tool used for monitoring, analyzing, and visualizing data in real-time. It allows users to create interactive dashboards and charts by connecting to various data sources, such as databases, cloud services, or monitoring systems. In Grafana, you can track metrics, set alerts, gain insights into system performance or business operations, all in real-time.
Grafana is commonly used in the following use cases:
- Real-Time Monitoring of Industrial Equipment
- Performance Monitoring
- Custom Dashboards for Different Stakeholders
- Quality Control and Defect Tracking
- Fleet and Asset Tracking
- Custom Alerts and NotificationsTo request a custom Grafana instance, contact us at support@nortech.ai.
In a Grafana instance you can access all of your data as soon as it reaches the cloud, or restrict the instance to only access data for certain Workspaces.
Permissions
To access Grafana’s features you need to have one of 2 roles:
- Viewer: Access to visualize existing dashboards and alerts;
- Editor: Access to visualize, create and edit dashboards and alerts.
By default all users are attributed the Viewer role. To attribute the Editor role to a user, contact the Nortech staff.
Nortech Cloud Data Source
Every Nortech Grafana instance comes with a specialized Nortech Data Source, which allows you to easily list your Cloud Metadata and query your Signal Data.
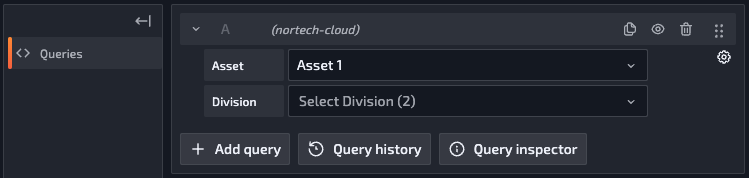
This datasource’s Query Editor is composed of a sequence of select inputs that list your Cloud Metadata, from Assets to Signals. Each input allows you to choose one item, rendering the next Metadata section.
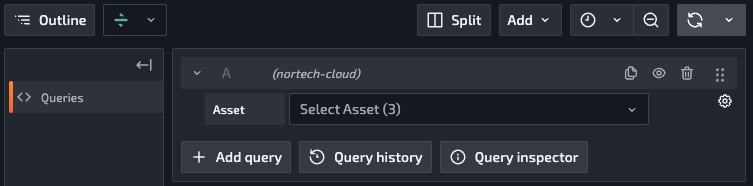
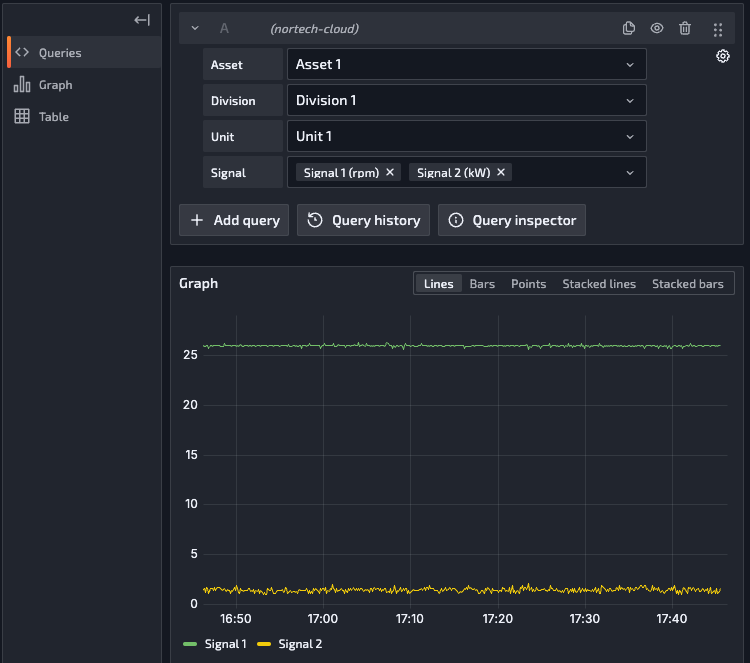
The Signal input shows the Signal name, its physical unit (between the parenthesis) and its description (if present). This input, contrary to the previous ones, allows you to select multiple items.
When at least one Signal is selected, the datasource will query the Signal data storage and fetch the corresponding data, which can be used in charts, tables and other dashboards.
This Datasource supports Grafana’s native Query options, with a maximum of 10.000 data points per query.
The Nortech Datasource doesn’t necessarily fetch all of the raw Signal data. To optimize performance and guarantee a smooth visualization experience, the resulting data is grouped into intervals depending on your Query options. Use the Advanced Options to further customize your queries. To fetch a full resolution data dump, use our API or Python SDK.
Advanced Options
Every query has a ⚙ button in its top right corner, which allows you to customize some advanced querying options. Currently the following options are supported:
- Extend Interval (%): Extend the query interval by this percentage value, in comparison with the original time range. Can be useful to back and forward fill the query results with points outside the dashboard’s range.
- Min Query Time Range: Minimum time range to query. Can be useful to back and forward fill the query results with points outside the dashboard’s range, in cases where the dashboard zoom is significant in comparison with the signal frequency.
- Aggregation: Aggregation function to apply to the query intervals.