Grafana
Nortech uses Grafana as the main edge data visualization tool. Grafana is a powerful open-source tool used for monitoring, analyzing, and visualizing data in real-time. It allows users to create interactive dashboards and charts by connecting to various data sources, such as databases, cloud services, or monitoring systems. In Grafana, you can track metrics, set alerts, gain insights into system performance or business operations, all in real-time.
Grafana is commonly used in the following use cases:
- Real-Time Monitoring of Industrial Equipment
- Performance Monitoring
- Custom Dashboards for Different Stakeholders
- Quality Control and Defect Tracking
- Fleet and Asset Tracking
- Custom Alerts and Notifications
To request access to Grafana on your edge device, contact us at support@nortech.ai.
Access
For you to access this App you need network access to the Nortech edge device connected to your assets. The App is available on the port 3000.
URL: http://<device-ip-address>:3000
Authentication
Currently, this app doesn’t have any authentication method. Anyone with access to the device is able to access it.
Nortech Edge Data Source
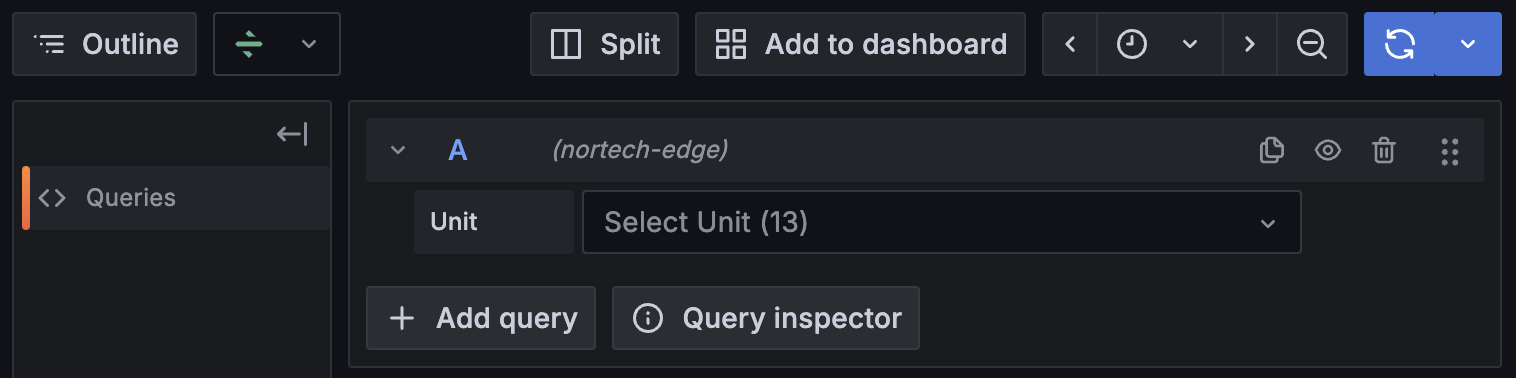
Every Nortech Grafana edge instance comes with a specialized Nortech Data Source, which allows you to easily list your Edge Metadata and query your Signal Data.
This datasource’s Query Editor is composed of a sequence of select inputs that allow you to navigate through your Edge Metadata, from Units to Signals. Each input allows you to choose one item, rendering the next Metadata section.
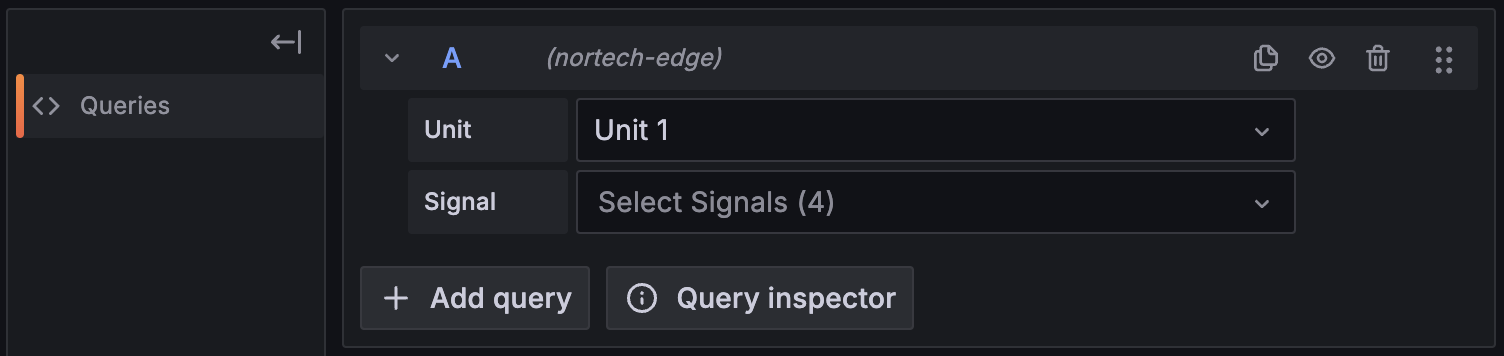
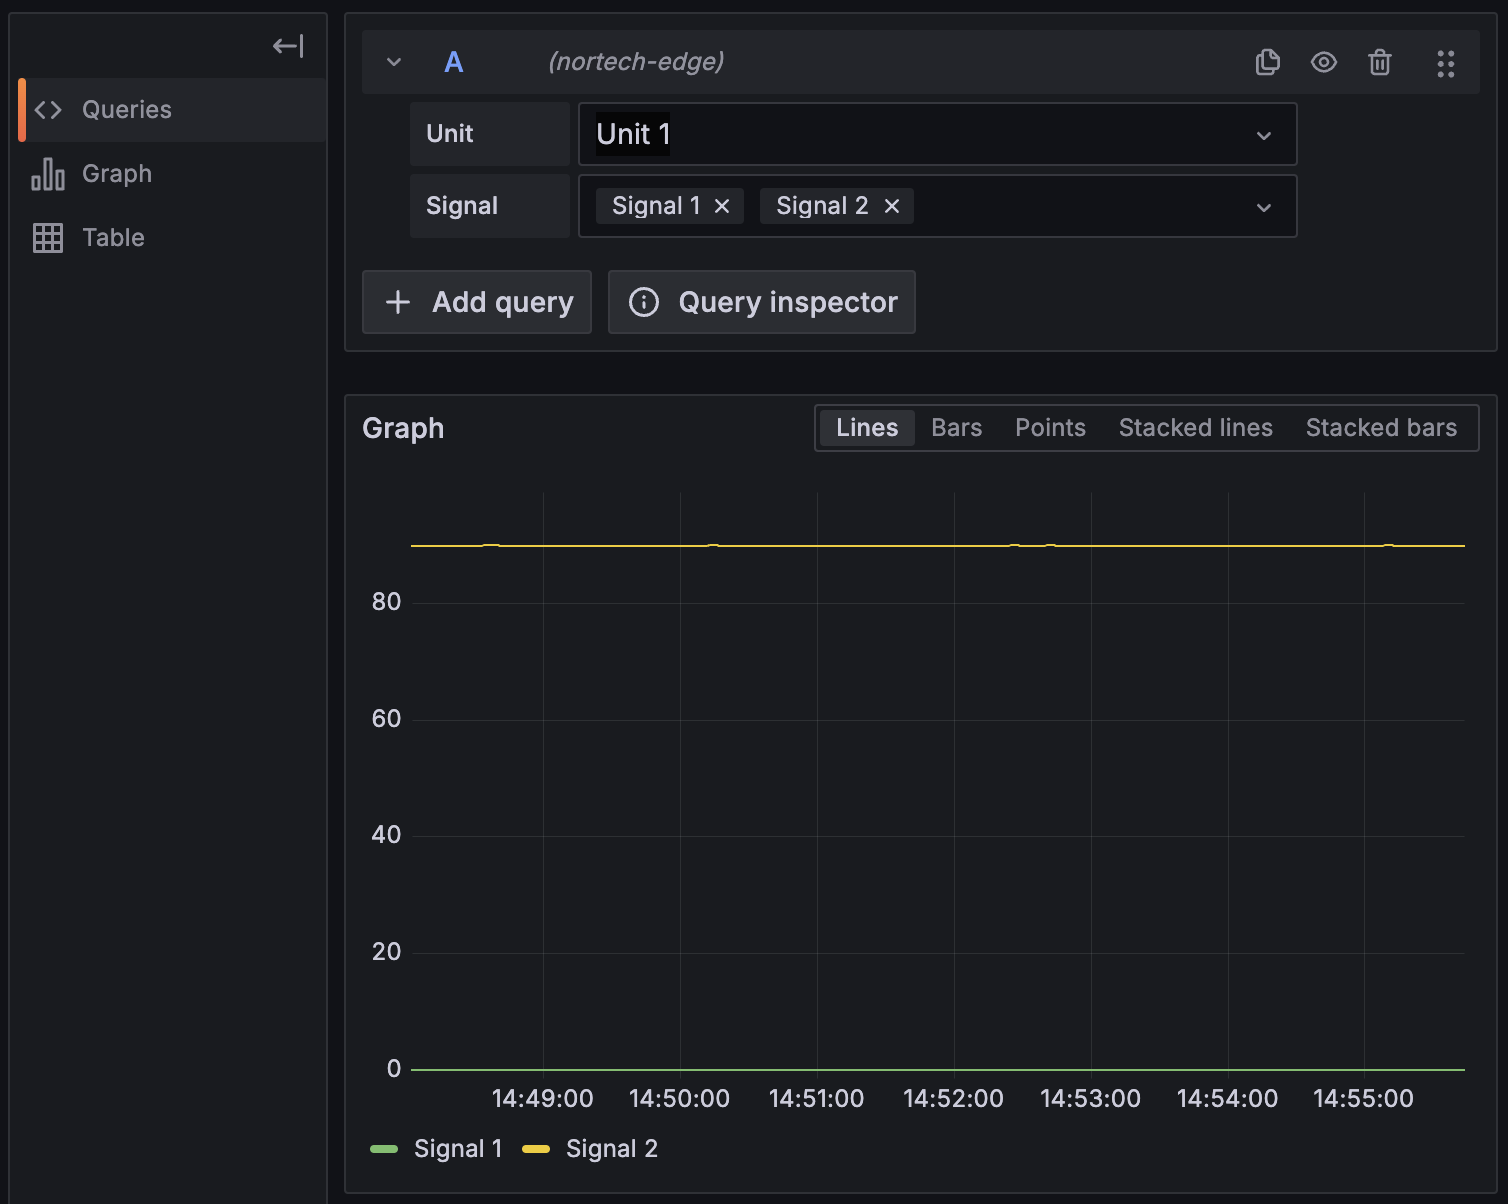
The Signal input shows the Signal name and its physical unit (between the parenthesis) and its description (if present). This input, contrary to the previous ones, allows you to select multiple items.
When at least one Signal is selected, the datasource will query the Signal data storage and fetch the corresponding data, which can be used in charts, tables and other panels.
This Datasource supports Grafana’s native Query options, with a maximum of 10.000 data points per query.
The Nortech Datasource doesn’t necessarily fetch all of the raw Signal data. To optimize performance and guarantee a smooth visualization experience, the resulting data is grouped into intervals depending on your Query options.